
Most small business owners have Google Analytics installed. Most of them never look at it.
And when they do open it, it’s usually to check one number — total visitors — and then close the tab feeling like they learned nothing useful.
That’s not your fault. Google Analytics 4 (GA4) is powerful, but it’s not designed for people who just want to know “is my website working?” It’s designed for analysts with time and training. For everyone else, it’s a wall of charts that doesn’t tell you what to do.
This guide cuts through that. You’ll learn which numbers actually matter for a small business, how to read them without a data science degree, and — most importantly — what to change when the numbers look bad.
Why GA4 Matters More Than You Think
Your website is your best salesperson. It works 24/7, never takes a day off, and talks to hundreds or thousands of potential customers every month. The problem is you can’t hear those conversations.
GA4 changes that. It shows you:
- Which marketing efforts are actually driving traffic (so you stop wasting money on the ones that aren’t)
- Where people drop off before contacting you (so you can fix whatever’s broken)
- Which pages build trust and which ones send people running
- Whether the people visiting your site are your actual customers or random traffic that will never convert
Without this data, you’re making every marketing and website decision based on gut feeling. That works sometimes. Data works consistently.
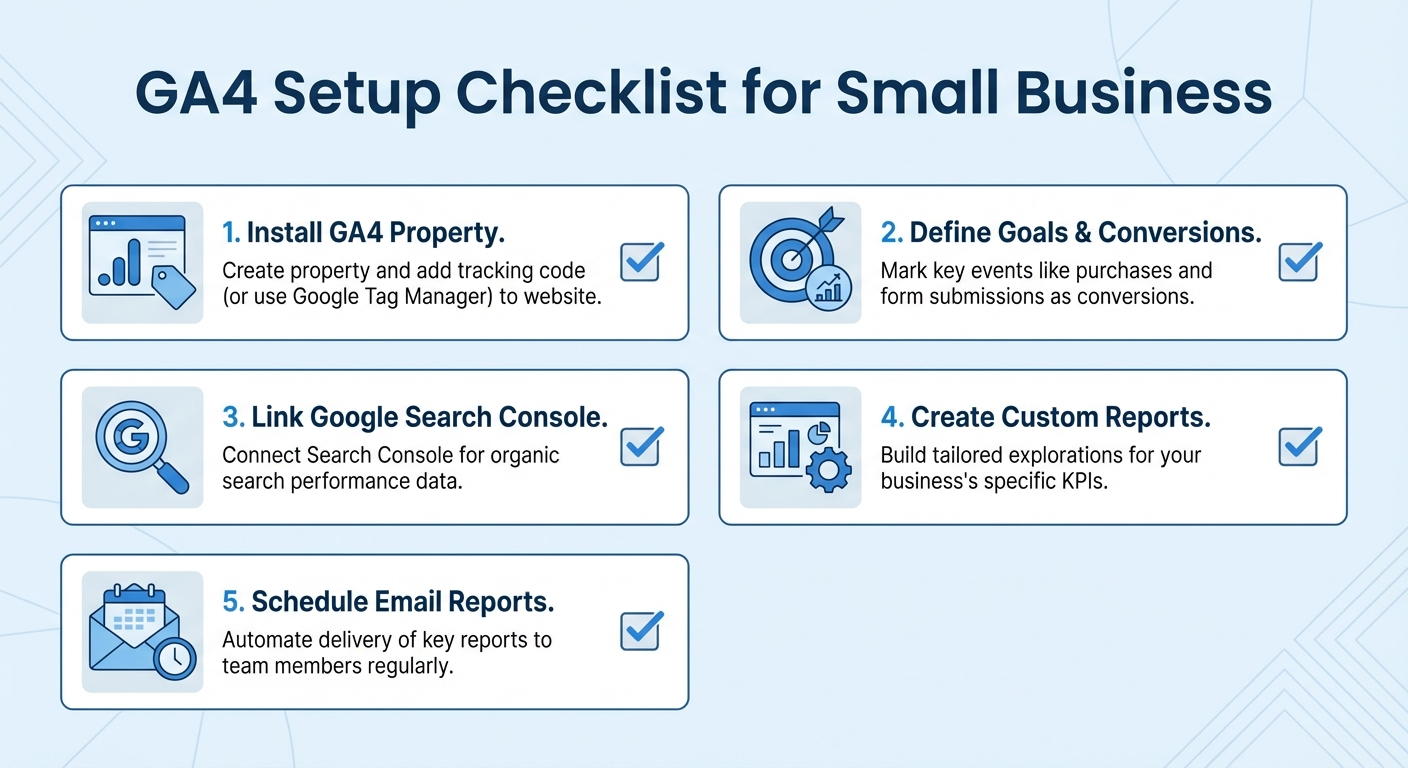
Getting GA4 Set Up Correctly
Before any numbers are useful, the setup needs to be right. If you installed GA4 more than six months ago and haven’t touched the settings, there’s a good chance you’re missing important data.
The minimum viable GA4 setup for a small business:
1. Install the tracking code properly. If you’re on WordPress, use the Site Kit by Google plugin — it handles everything automatically. On Squarespace, Wix, or Shopify, there are native integrations. On custom sites, paste the GA4 tag into the <head> of every page.
2. Set up conversion events. This is where most businesses fail. By default, GA4 tracks page views and sessions. It does NOT automatically know when someone submits your contact form, calls you, or books an appointment. You have to tell it. Mark these actions as conversions in GA4’s admin settings, or configure them via Google Tag Manager.
3. Connect Google Search Console. This free linkage shows you what search queries are driving visitors. It’s inside GA4’s Admin panel under “Search Console links” and takes two minutes. The data it unlocks is worth it.
4. Filter out your own visits. If you visit your own website frequently (you should be), those visits inflate your numbers. Add an IP filter in GA4’s Admin settings to exclude your office IP address.
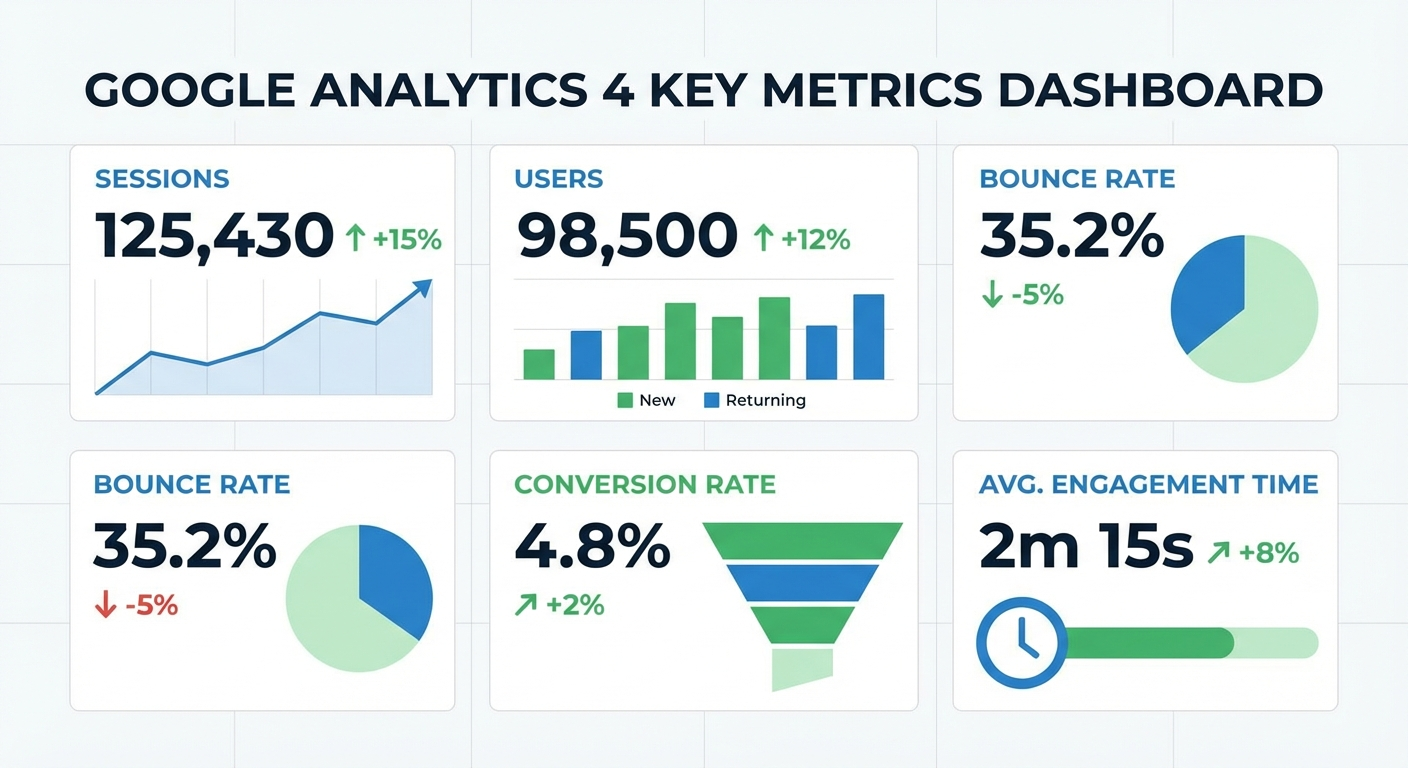
The Only Metrics That Actually Matter
GA4 shows you dozens of metrics. Here are the seven that matter for a small business, what they mean, and what good looks like.
1. Users
What it is: The number of unique individuals who visited your site in a given period.
What to watch: Month-over-month trend. Are you growing, flat, or declining? A 5–10% monthly increase is healthy for an established site. Brand-new sites can grow much faster.
What it doesn’t tell you: Whether those visitors are your target customers. A spike in users means nothing if they’re the wrong people.
2. Sessions
What it is: Each time someone visits your site, that’s a session. One user can have multiple sessions (they visit Monday, come back Thursday).
What to watch: Session-to-user ratio. If it’s above 1.3–1.5, people are returning to your site — that’s a good sign. If it’s basically 1.0, almost no one ever comes back after their first visit.
3. Engagement Rate
What it is: The percentage of sessions where someone actually engaged — scrolled, clicked, stayed longer than 10 seconds. GA4 replaced the old “bounce rate” with this metric. Higher is better.
Benchmarks: Under 40% is a problem. 50–65% is average. Over 65% means your content is landing.
What to do if it’s low: Your page isn’t matching what people expected when they clicked. Misaligned ad targeting, a slow-loading page, or content that doesn’t answer the question they came with.
4. Average Engagement Time
What it is: How long, on average, users are actually engaging with your site (not just having the tab open).
Benchmarks: For service businesses, 1–2 minutes is typical. For content-heavy sites (like this one), 2–4 minutes. Under 45 seconds usually means people are leaving quickly.
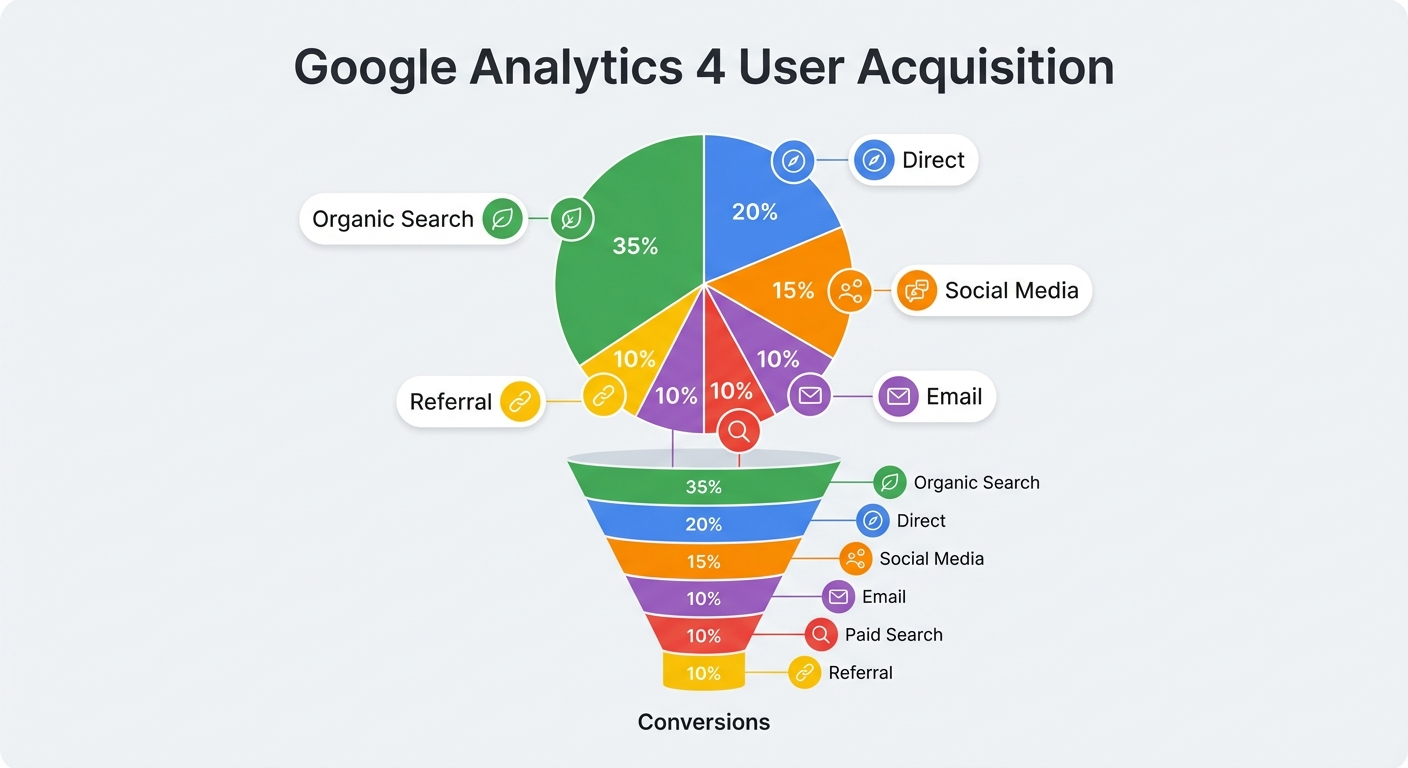
5. Traffic Sources (Acquisition)
What it is: Where your visitors are coming from — organic search, direct (typed your URL), referral (another site linked to you), social media, paid ads, email.
Why it matters: This is your marketing scorecard. If you’re spending money on Instagram ads but the “Social” channel shows almost no traffic, that’s a problem worth investigating. If organic search is your #1 channel, your SEO efforts are paying off.
6. Top Landing Pages
What it is: The first page visitors land on when they arrive at your site.
What to look for: Are people landing on your most important pages (homepage, service pages, booking page)? Or are they landing on old blog posts or pages you forgot about? Your top landing pages are doing the heavy lifting — they should look great and have clear calls to action.
7. Conversions
What it is: The specific actions you’ve defined as valuable — form submissions, phone call clicks, appointment bookings, purchase completions.
This is the whole point. Traffic without conversions is just noise. Your conversion rate (conversions ÷ sessions × 100) tells you how effectively your site turns visitors into leads. For service business contact forms, 1–3% is average. Above 3% is strong. Under 1% means something is broken.
Reading the Acquisition Report: Your Marketing Scorecard
In GA4, go to Reports → Acquisition → Traffic Acquisition. This is where you get honest about your marketing.
You’ll see sessions broken down by channel. Here’s how to interpret the main ones:
Organic Search: People found you on Google without a paid ad. This is “earned” traffic that compounds over time with good SEO. If this channel is flat or declining, your site may have a penalty, or competitors have surpassed you.
Direct: Someone typed your URL or came from a bookmark. High direct traffic usually means strong brand recognition or repeat customers. It can also mean your email marketing isn’t tagged properly (more on this below).
Referral: Another website linked to yours. This could be a directory listing (Google Business Profile, Yelp, Houzz), a press mention, or a partner site. High-quality referral traffic is excellent — these visitors come with built-in trust.
Organic Social: Unpaid posts on social media that drove clicks. Most service businesses get low organic social traffic, which reflects how little organic reach platforms like Facebook and Instagram give you these days.
Paid Search / Paid Social: Traffic from ads. Compare this to your ad spend to understand your cost per visitor, and compare to conversions to understand your cost per lead.
Finding Where People Drop Off
One of the most valuable things GA4 can show you is where visitors abandon your site before converting.
Go to Reports → Engagement → Pages and Screens. Sort by sessions. Look at your top-visited pages. Then ask:
- What’s the engagement rate on each key page? Under 40% on your services page is bad.
- Is your contact or booking page getting visits proportional to the rest of the site? If 500 people visit your homepage but only 12 visit your contact page, something is blocking that journey.
You can also build a basic funnel in GA4’s Explore section. Map out the path you want visitors to take: landing page → services page → contact page → thank-you page. GA4 shows you exactly where people exit. That exit point is your biggest optimization opportunity.
Common culprits when people drop off:
- Slow page load (mobile users especially will not wait)
- No clear next step — visitors don’t know what to click
- Pricing is too prominent too early (or too hidden)
- Trust signals are missing (reviews, credentials, before/after examples)
- The page looks broken on mobile
Setting Up Reports You’ll Actually Check
The reason most business owners don’t use GA4 is that opening it requires effort. Fix that with two things.
Custom Dashboard: In GA4, go to Reports → Library and create a custom report or collection with just your seven key metrics. Save it as your homepage view. When you open GA4, you see exactly what you need in under 30 seconds.
Scheduled Email Reports: GA4 can email you a report weekly or monthly. Set this up in the Reports section by clicking the share icon and selecting “Schedule email.” Choose Monday morning so you start each week with a data snapshot. You’ll actually read it because it comes to you, not the other way around.
Google Looker Studio (free): If you want something even simpler, connect your GA4 data to Google Looker Studio (formerly Data Studio). Build a one-page dashboard with your key metrics displayed as big, simple numbers. Share it with your team or bookmark it as your browser homepage.
A Monthly Analytics Review: 20 Minutes That Make a Difference
Once a month, block 20 minutes and answer these six questions:
- Are users growing? Compare this month to last month and year-over-year.
- Which channel drove the most qualified traffic? Look at engagement rate and conversions by source.
- What’s my conversion rate? Is it improving, steady, or declining?
- Which pages are underperforming? High traffic, low engagement rate — those need attention.
- Are there any anomalies? A sudden traffic spike or drop usually has an explanation worth finding.
- Did anything I tried last month show up in the data? Published new content? Ran an ad? Started posting on LinkedIn? Check if it moved the needle.
That’s it. Twenty minutes, six questions, actionable output.
Common GA4 Mistakes Small Businesses Make
Mistake 1: Checking the wrong time period. Week-to-week traffic fluctuates a lot. Always compare the same period year-over-year or use 30-day rolling averages for meaningful trends.
Mistake 2: Celebrating traffic spikes without checking quality. A post going viral on Reddit can bring 2,000 visitors who have zero interest in your services. Traffic without engagement and conversions is just noise.
Mistake 3: Not setting up conversions. If you don’t define what “winning” looks like in GA4, it can’t tell you if you’re winning. Set up conversion events. This is non-negotiable.
Mistake 4: Ignoring mobile. In GA4, segment your data by device type. Most service businesses get 55–70% of traffic from mobile. If your mobile engagement rate is dramatically lower than desktop, your mobile experience is broken and you’re losing a majority of your visitors.
Mistake 5: Acting on a single week of data. One bad week doesn’t mean your marketing isn’t working. One bad month warrants investigation. One bad quarter warrants action.
Connecting Analytics to Action
Data without action is just trivia. Here’s the direct line from what GA4 shows you to what you should do:
| GA4 Signal | What It Means | Action |
|---|---|---|
| Low organic traffic | SEO isn’t working | Improve content quality, fix technical issues |
| High traffic, low conversions | Site isn’t convincing | Rewrite CTAs, add social proof, improve mobile UX |
| Low engagement rate on key pages | Content mismatch | Rewrite page to match visitor intent |
| High direct traffic, low referral | Limited online presence | Build directory listings, get more backlinks |
| High mobile traffic, low mobile engagement | Poor mobile experience | Prioritize mobile UX improvements |
| Paid traffic not converting | Ad targeting or landing page issue | Improve landing page or refine ad audience |
The Bigger Picture
Google Analytics 4 isn’t just a reporting tool — it’s a feedback loop between your marketing investment and real results. Every blog post you publish, every ad you run, every email campaign you send creates a ripple in your analytics. GA4 lets you see those ripples.
The businesses that grow consistently aren’t necessarily the ones with the biggest budgets or the most creative marketing. They’re the ones that pay attention to what’s working, double down on it, fix what isn’t, and stop doing what doesn’t move the needle.
That discipline starts with actually looking at your data.
Need help making sense of your website analytics or improving your conversion rate? Contact Monsoft Solutions — we help small businesses turn data into action.
Related reading: SEO in 2026: What Actually Works for Small Businesses | Landing Page Optimization Guide | Local SEO Schema Markup Guide | Google Business Profile Optimization